IoT and visualization in buildings
Issue :
read all articles online
read as pdf
Many thousands of devices are currently connected to the IoT and the number is increasing. These devices generate huge volumes of data whose information has to be captured, filtered, processed and analyzed in a timely manner in order to fulfill its purpose in the IoT. That’s why WinShine has developed a solution for collecting data and visualizing IoT applications.
Basically, data visualization is the visual representation of common tables or spatial data. IoT-based data visualization can support companies in intelligent real-time data analysis.
Guide screen
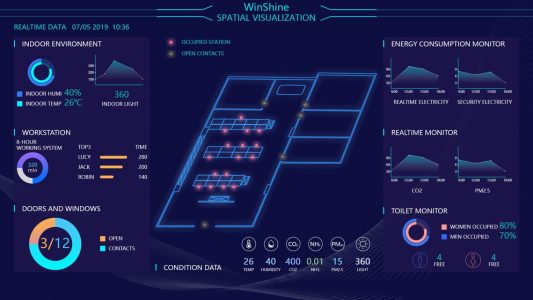
The visualization of environmental quality includes not only temperature and humidity, but also air quality. WinShine’s battery-free temperature and humidity sensors and air quality sensors based on the EnOcean protocol (such as CO2, CO, PM, etc.) can display the environmental status in real time. The platform visualizes real-time data, trends and other information for analysis.
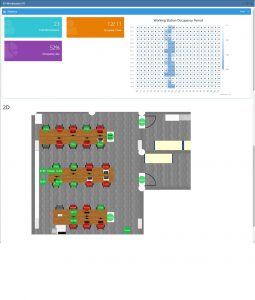
The visualization of space occupation allows building managers to monitor space resources at all times and analyze costs and benefits in order to adjust and plan the space accordingly.
- With a seat occupancy sensor based on the EnOcean protocol, the occupancy status of the station can be displayed in real time. Office or building managers can see the seating arrangement in 2D or 3D, occupancy status and time, a heat map and a trend graph.
Management platform
Easy IoT applet Reserve App
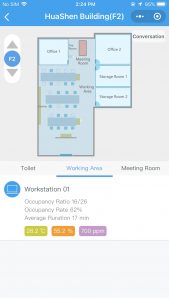
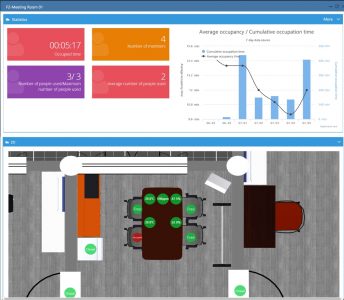
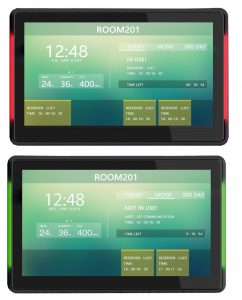
- By using solar-powered occupancy sensors and personnel density sensors based on the EnOcean protocol in combination with visualization solutions, the occupancy status and time as well as the occupancy rate can be visualized. This is helpful, for example, when booking conference rooms.
Management platform
iPad Guide
- Wireless door and NH3/H2S sensors based on the EnOcean protocol record data on air quality and the number of visitors as well as whether, for example, a toilet is free or occupied. The information is displayed on a guide screen outside the restroom.
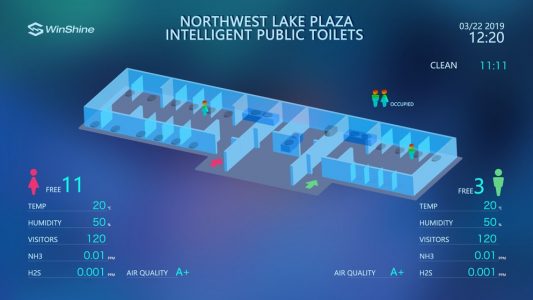
Guide screen
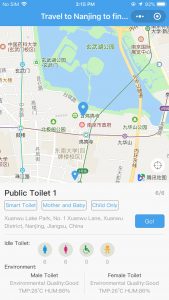
Find toilet app
Asset visualization management allows assets to be managed using RFID technology and 3D modeling. Locations, inventories, status, environment, alarms and other information is displayed visually.
When visualizing energy consumption, monitoring points are defined for each trunk cable in the building. Each electricity meter reports consumption and temperature data to the cloud platform at regular intervals via the intelligent gateway.
For security and navigation in buildings, EnOcean-based smoke detectors and cable temperature sensors are used for the following tasks:
– Smoke, cable temperature and overcurrent detection
– Fire alarm systems
– Visual display of detection points and status
– Alarm information
With the beginning of the 5G era, ultra-bandwidth, high reliability, low latency and massive access will bring even greater market opportunities for the IoT industry. WinShine’s visualization solution will interoperate and link with countless IoT devices receiving, their data and displaying relationships between objects and states in 3D.
New articles in Smart Spaces


Top articles